
Stock Market Crash History: 1929, 1987, 2008 and What Makes 2026 Different

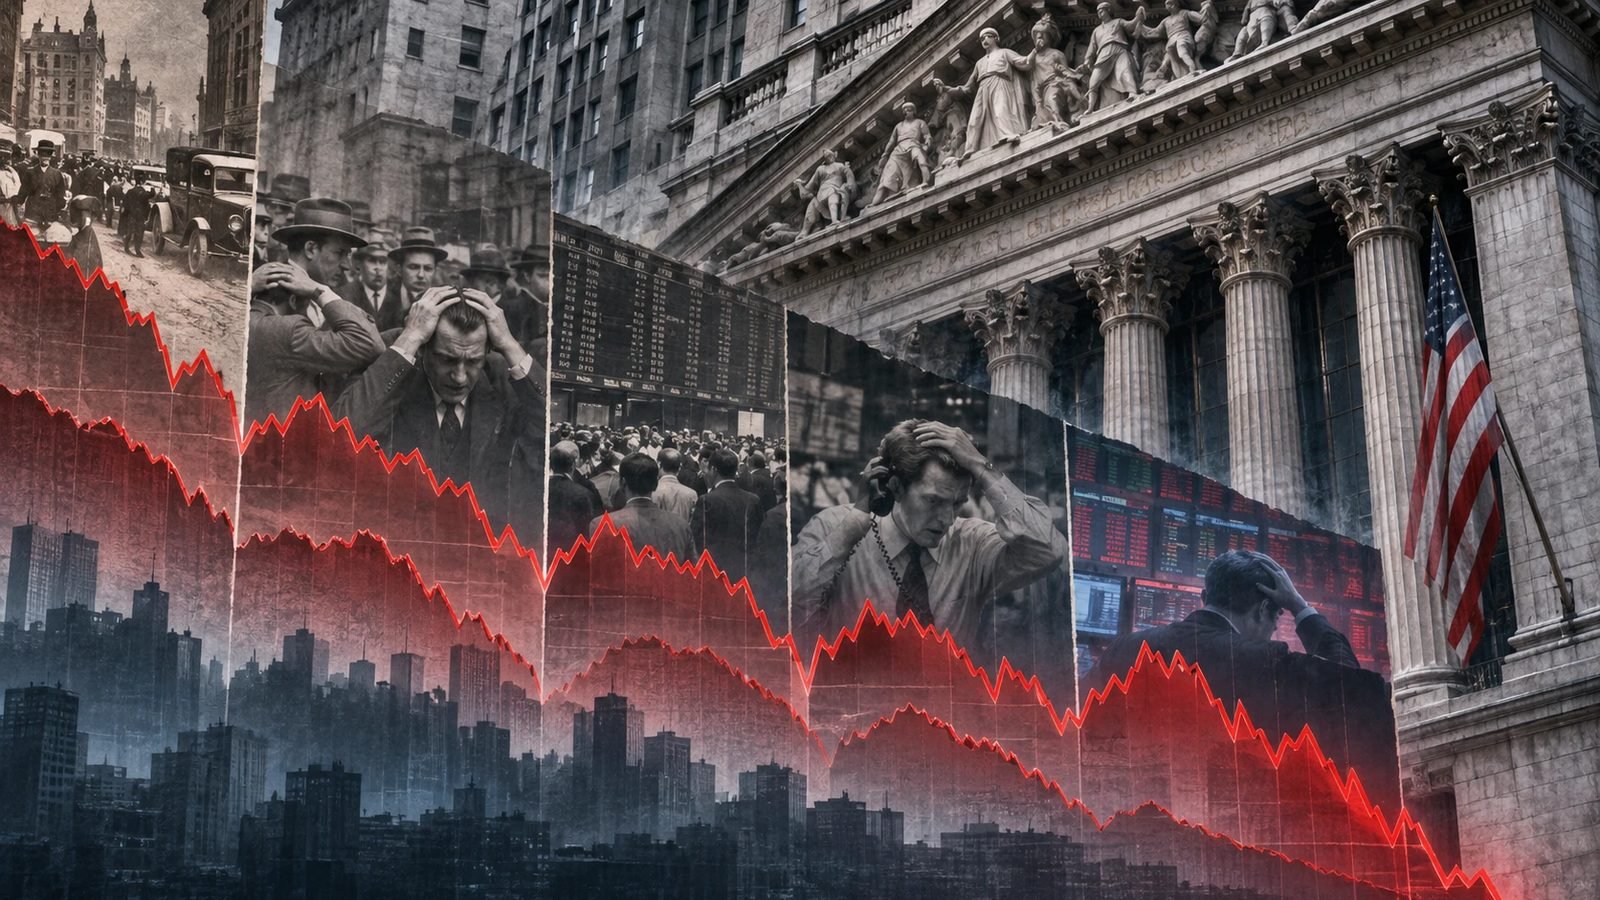
Timelines of stock market crashes often line up 1929, 1987, 2008, 2020 and the latest selloff side by side. The pictures look alike: red arrows, worried traders, falling prices. The events themselves were very different.
Some declines happened in a single session. Others lasted years. Some came with bank failures and recessions, while others were sharp repricings that passed without lasting economic damage. Comparing them fairly means stating what was measured, which index was used and over what window. This page sets out the main episodes in stock market crash history with that discipline, using Federal Reserve History essays, a long-run returns dataset and daily index data. The 2026 figures run through the November 6, 2026 close.
Key Takeaways
- 1929 was a crash and a long decline: the Dow fell nearly 13% on October 28, 1929 and about 89% from its peak by July 1932, according to Federal Reserve History.
- 1987 was the largest one-day fall: the Dow dropped 22.6% on October 19, 1987, still the largest one-day percentage decline on record.
- 1987 recovered quickly: the Dow regained 57% of the Black Monday loss within two sessions and passed its pre-crash high within two years.
- 2008 was a financial crisis: the S&P 500's 2008 total return was -36.55% in Damodaran's dataset.
- 2026 is a correction so far: the Nasdaq's November 5, 2026 close was 11.9% below its October 6 record, by our calculation from FRED data.
What Counts as a Stock Market Crash?
There is no single official percentage that defines a crash. Market commentary commonly uses "correction" for a fall of at least 10% from a recent high and "bear market" for a fall of at least 20%. A crash usually describes a very sudden, steep drop, often over one or a few days.
A one-day decline and a peak-to-trough bear market are different statistics. A calendar-year return is a third. Mixing them in one ranking makes some episodes look worse or milder than they were, so each figure below is labeled by type.
Three Ways to Measure a Decline
A one-session change compares two consecutive closes. A peak-to-trough decline compares the highest close before a fall with the lowest close after it, however long that takes. A calendar-year return compares December 31 with the next December 31. Each tells a different part of the story.
Why the Index Shapes the Comparison
Older episodes are usually measured with the Dow Jones Industrial Average, a price-weighted index of 30 large companies. Newer comparisons often use the S&P 500 or the Nasdaq Composite. Different indexes can fall by different amounts in the same event, so comparing a Dow figure with a Nasdaq figure needs care.
How Major Crashes Compare by Measurement Type
The table lists each episode with a verified figure and the type of measurement behind it. It does not rank the episodes, because the measures are not the same.
| Episode | Verified figure | Measurement type | Main distinction |
|---|---|---|---|
| October 28, 1929 | Dow nearly -13% | One session | Start of a long collapse |
| 1929 to 1932 | Dow about -89% from peak | Multi-year peak to trough | Prolonged depression-era decline |
| October 19, 1987 | Dow -22.6% | One session | Fast global selling, quick recovery |
| 2008 | S&P 500 -36.55% | Calendar-year total return | Financial-system crisis |
| 2020 | S&P 500 +18.02% | Calendar-year total return | Positive year despite a sharp crash |
| 2022 | S&P 500 -18.04% | Calendar-year total return | Negative year, not full peak to trough |
| November 5, 2026 | Nasdaq Composite -5.5% | One session | AI-related repricing |
The 1929 and 1987 figures come from Federal Reserve History. The 2008, 2020 and 2022 figures come from Damodaran's historical returns dataset. The 2026 figure is our calculation from FRED's daily Nasdaq Composite closes.
Why There Is No Single Ranking
A true ranking of peak-to-trough declines would need the same index and the same closing-level data for every episode. Combining a one-day Dow loss with an annual S&P 500 return produces a list of unlike numbers. The table above keeps each figure in its own category instead.
How to Read the Table
Read each row as an answer to its own question. The 1987 row answers how far the Dow fell in a day. The 1929 to 1932 row answers how far it fell from top to bottom. The 2008 row answers how a full calendar year ended. Comparing rows of different types is where most stock market crash history lists go wrong.
Why Did 1929 Become More Than a Bad Week?
The Federal Reserve History essay on the 1929 crash reports that the Dow declined nearly 13% on Black Monday, October 28, 1929, and nearly 12% the next day, Black Tuesday. By mid-November, the Dow had lost almost half its value.
The slide continued through the summer of 1932. On July 8, 1932, the Dow closed at 41.22, its lowest value of the twentieth century and 89% below its 1929 peak of 381.17. The index did not reach its 1929 high again until November 23, 1954.
The Economy Around the Crash
The crash did not act alone. Economic contraction, falling confidence and stress in the banking system helped turn a market break into a years-long crisis. That is why comparing a single modern trading day with the full 1929 to 1932 outcome is misleading. One is a session; the other is a multi-year path.
What the Annual Data Shows
Damodaran's series records S&P 500 total returns of -8.30% in 1929, -25.12% in 1930 and -43.84% in 1931. Those are calendar-year figures. They understate the peak-to-trough fall, because the market's top came in September 1929 and its low in mid-1932, which no single calendar year captures.
What Made 1987 Different?
The Federal Reserve History essay on the 1987 crash reports that on October 19, 1987, Black Monday, the Dow fell 508 points, or 22.6%, in one session. It describes this as the largest one-day stock market decline in history.
Stocks had raced higher before the crash. By late August 1987, the Dow had gained 44% in about seven months. In mid-October, a larger-than-expected trade deficit and a falling dollar unsettled investors, and markets in Asia fell before U.S. trading opened on October 19.
Causes Identified Afterward
The essay lists several contributors identified by regulators and economists: growing international investment in U.S. markets, the popularity of "portfolio insurance" strategies that sold as prices fell, and structural flaws such as different settlement timelines across stock, options and futures markets. Exchanges also lacked tools to pause trading.
Reforms and Recovery
After Black Monday, regulators aligned trade-clearing rules and introduced circuit breakers. Under current rules, the New York Stock Exchange halts trading temporarily when the S&P 500 falls 7%, 13% and 20%. The Federal Reserve said it stood ready to provide liquidity. The Dow regained 57% of its loss within two sessions and passed its pre-crash high in under two years.
No Recession Followed
Unlike 1929, the 1987 crash was not followed by a recession or a banking crisis, according to the Federal Reserve History essay. A record one-day fall did not lead to a record economic downturn. That contrast is one of the clearest lessons in stock market crash history.
How Should 2008 and 2020 Be Understood?
The 2008 financial crisis involved the solvency and funding of major financial institutions and housing-related assets. Damodaran's series shows a -36.55% S&P 500 total return for 2008, followed by +25.94% in 2009. A full-year figure gives a sense of the damage, but it is not the maximum drawdown, which spanned parts of two calendar years.
The 2020 pandemic shows the opposite risk. The S&P 500's 2020 total return was +18.02% in the same series, even though the year included a severe crash in its first quarter. A positive annual figure did not mean investors had a calm year.
Why Annual Figures Hide Crashes
Calendar-year returns only compare two dates. Everything that happens in between disappears. FinLoom's stock market return by year table shows the full range of annual results, and why they should not be used to judge how deep a decline went.
The 2022 Decline
The S&P 500 returned -18.04% in 2022 in Damodaran's series, followed by +26.06% in 2023. Like 2008, the 2022 annual figure describes a calendar window, not the full peak-to-trough decline, which started near the end of 2021 and ended in late 2022.
What Makes the 2026 Episode Distinctive So Far?
October 2026 combined technology weakness with broad gains elsewhere. Janus Henderson reported that the Nasdaq Composite lost 5.3% while the equal-weight S&P 500 gained 5.0%, and that nine of eleven sectors rose. Investors were particularly concerned about returns on AI and data-center spending.
November 5 brought wider losses. FRED's Nasdaq Composite series shows the index closing at 24,315.00 that day, down 5.5% from the previous close and 11.9% below its October 6 record close of 27,599.89. That meets the common definition of a correction.
What the 2026 Data Does Not Establish
A correction in one index does not show that 2026 will resemble 1929, 1987 or 2008. The S&P 500 was about 6% below its October high on November 5, short of a correction, and well short of a bear market. Historical comparisons can show the range of past outcomes but cannot predict which one comes next.
Where to Find the Dated 2026 Figures
FinLoom's stock market crash 2026 statistics set out twelve dated figures for October and November, each with its window and source. They are the best reference for the current episode, rather than any single headline, and they will be easier to place in stock market crash history once November's full data is available.
How Crash History Shaped Today's Safeguards
Several features of today's markets exist because of past crashes. After 1929, the Federal Reserve History essay notes that the Fed had worried about lending to stock speculators, as commercial banks and other lenders kept increasing loans to brokers before the crash. That experience shaped later debates about credit and speculation.
After 1987, regulators introduced circuit breakers that pause trading during steep declines, and aligned clearing rules across stock, options and futures markets. The Federal Reserve's public statement that it stood ready to provide liquidity, and its encouragement of bank lending, set a precedent for how central banks respond to market panics.
What Safeguards Can and Cannot Do
Circuit breakers slow trading so investors can take in information. They do not stop prices from falling over days or weeks. Central bank support can ease funding stress, but it cannot set stock prices. Safeguards reduce some risks from disorderly trading; they do not remove the risk of loss.
Why the Safeguards Did Not Stop 2008 or 2020
Both 2008 and 2020 brought steep declines despite these protections. The safeguards address the mechanics of trading and funding, not the underlying shocks, such as housing losses in 2008 or a pandemic in 2020. That is a reminder that stock market crash history keeps adding new kinds of shocks.
What Is the Most Useful Lesson From Crash History?
Market declines should be judged by depth, duration, breadth and the economic conditions around them. A fall in an index measures asset prices. It does not by itself measure unemployment, loan losses, economic output or the health of the banking system.
History is useful because the episodes differ. 1929 shows how a crash can become a long depression. 1987 shows how a record one-day fall can recover within two years without a recession. 2008 shows how a banking crisis can deepen a market decline. None of them tells us how the next one will unfold. Taken together, stock market crash history shows a wide range of outcomes rather than a single repeating script.
How Long Recoveries Took
Recovery times varied widely. After 1929, the Dow took until November 1954 to regain its 1929 high, according to Federal Reserve History. After 1987, it took less than two years. Those two outcomes, both after historic crashes, show why a single "average recovery time" can mislead.
What Investors Can Control
Investors cannot control when a crash happens or how long it lasts. They can control how much they hold in stocks, how diversified those holdings are, and whether money needed soon sits in safer assets. FinLoom's guide to stock analysis fundamentals covers the company-level checks that help investors understand what they own.
Questions to Ask When a New Crash Is Compared With History
Each new selloff brings comparisons with famous crashes. A few questions help judge whether a comparison is fair. Which index is being compared, and is it the same in both periods? Is the figure a one-day move, a fall from a peak or a calendar-year return? Is the comparison made at a similar point in each episode, or is a finished crash being compared with one still underway?
Applying those questions to 2026 shows why caution is needed. The November 5 Nasdaq fall was a one-day move in a different index from the Dow figures used for 1929 and 1987, and the episode was only weeks old.
Common Mistakes When Reading Stock Market Crash History
The first mistake is ranking crashes by mixing one-day falls with annual returns. The second is assuming every crash leads to a depression. 1987 did not. The third is assuming every crash recovers quickly. 1929 did not.
The fourth is comparing figures from different indexes without saying so. The fifth is treating a partial-year or single-day 2026 figure as comparable with completed historical episodes. Labeling each number by index, window and type avoids most of these errors.
Frequently Asked Questions
Was the 1987 Crash Worse Than November 2026's Decline?
On a one-day basis, yes. The Dow fell 22.6% on October 19, 1987. The Nasdaq Composite fell about 5.5% on November 5, 2026. The indexes and dates differ.
What Caused the Stock Market Crash of 1929?
Federal Reserve History describes a speculative boom followed by sharp selling, worsened by economic contraction and banking stress. The Dow lost about 89% from its peak by July 1932.
Did the Stock Market Crash in 2020 When the Year Was Positive?
Yes. A sharp decline early in 2020 coexisted with an 18.02% full-year S&P 500 total return in Damodaran's series, because prices recovered before year-end.
Is the 2026 Correction a Financial Crisis?
Not on the evidence so far. A correction measures a fall in prices. A financial crisis involves wider strains such as bank failures or funding problems, which were not reported.
Which Was the Largest One-Day Crash?
Federal Reserve History describes October 19, 1987, when the Dow fell 22.6%, as the largest one-day stock market decline in history.
Resources
- Federal Reserve History: Stock Market Crash of 1929
- Federal Reserve History: Stock Market Crash of 1987
- Aswath Damodaran, NYU Stern: Historical Returns on Stocks, Bonds and Bills
- FRED: Nasdaq Composite Index
Returns and index figures are historical and refer to the dates and indexes named. They are not forecasts. Investors cannot invest directly in an index. This article is educational and is not financial advice.